Deep Sea Fish and Sediment Surveys in the Gulf
Inquiry is Hard Work! August 6, 2013
Posted by E. McCormack, C-Image Teacher-at-Sea
Most of us have had to memorize the steps of the scientific method (or the steps of the inquiry process, depending on  when you last took a science course!), but not everyone recognizes that thinking like a scientist requires a different outlook than other disciplines. What we tend to forget is how new so much of our knowledge really is! It was only about 350 years ago when Robert Hooke invented his microscope and we realized there was a whole world of organisms out there that we couldn’t see. Even though there is so much information out there, available with a few clicks or a swipe of the finger, there are still so many things we don’t understand, and things we don’t even know we don’t understand!
Asking the Right Questions
The first stage that we go through as scientists (professional or otherwise) is observing the world and trying to find something interesting to think about. What is it I don’t really understand? What fascinates me? What do I want to find out? In the field of ocean science, we have so many unanswered questions, and more often than not, investigating opens the door to more questions than we had before. In our case, not only are we trying to figure out what happened in the Gulf after the oil spill, we are trying to figure out how the system works. To me, the hardest part of the inquiry process is

Deciding what to test, and how results relate to your question, is one of the hardest parts of experimental design. As scientists, we have to rely on tests that are available and practical and have to piece together small pieces of data to puzzle out the bigger picture.
deciding what to ask about, and then after asking the question, working out how to find an answer that means something!
Science is data driven, and scientists base their conclusions on observations of the conditions of the system they study. In order to come to a valid conclusion, a scientist must have data that is reliable and meaningful. A scientist must make sure they have data that really relates to the question they are asking, in a way that they can actually test. When designing an experiment, we often have to invent a way to quantify what we observe, and then think about how that ties back to our big picture question. Imagine you are trying to test the effect of dispersants on bacteria in the water. It is hard work to collect and test samples from a boat, and really expensive, so you culture bacteria in a petri dish, add dispersants, and observe the results. You do the test perfectly and collect great data. But does it really answer your question about bacteria in the water column?? Thinking about how to break down your question without changing the question is the art of science, and is really hard to get right!
Collecting the Right Data
Another important factor to consider when trying to answer scientific questions is the ideas of control and repetition, both to make sure your data was collected correctly, and then to make sure you have something to compare your data against. How can you figure out the effect something had on an outcome if you don’t know what the outcome would have been before everything changed? One of the issues that we have in investigating the Gulf spill is access to pre-spill data to compare with our new data. Sometimes the best we can do is compare parts of the Gulf that were less affected by the spill to areas closer to the Deepwater Horizon event site. We take lots of samples from lots of depths, lots of locations, and over three years and almost 18 cruises. This means that we have to process and compile that mountain of data to look for trends and patterns that might allow us to answer our questions.
Bite Sized Data
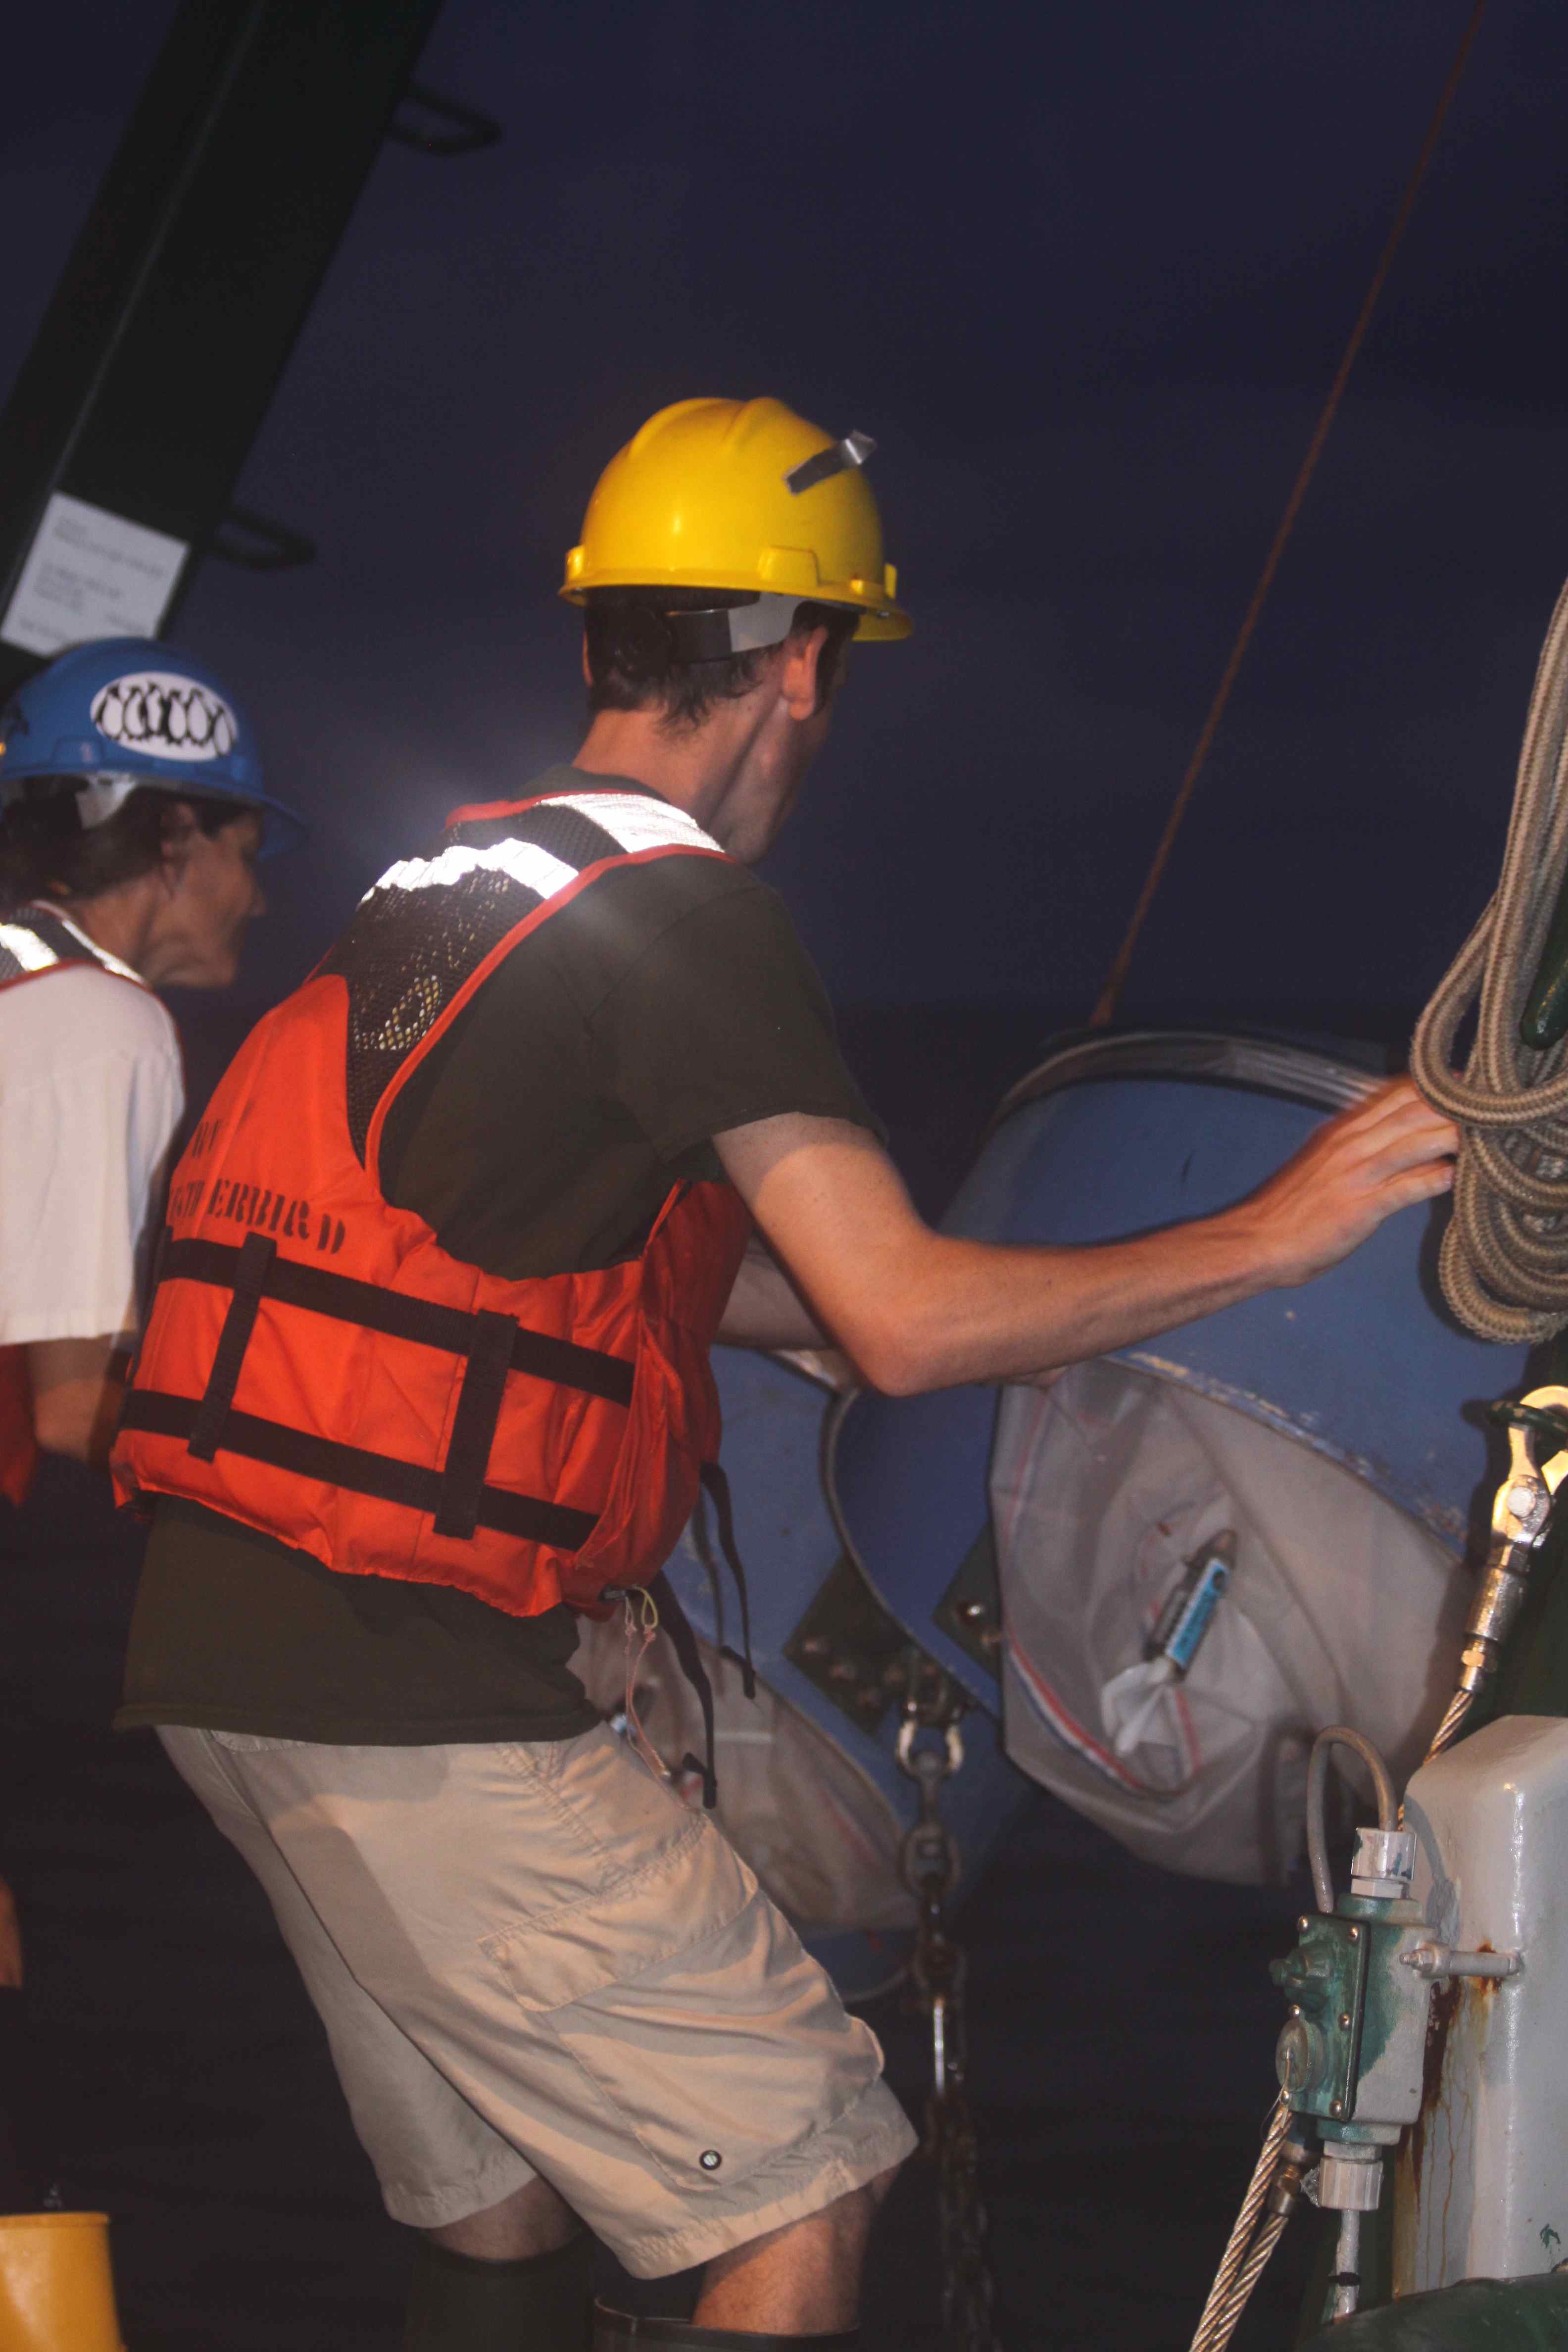
Joseph Terrano and Heather Broadbent launching the bongo nets at dawn. Collecting data can involve lots of heavy lifting, late nights and early days.
Limiting a broad question to a more specific and manageable measure is key to a successful experimental design. We can’t go to sea with the question, “What happened to the Gulf after the oil spill.” It is too broad, and impossible to answer with a single measure. It is kind of like trying to eat your entire steak in one bite—you are very likely to choke. Instead we have to cut the meat into manageable pieces. Same with big scientific questions. On the boat, we have lots of scientists looking at different measures that give a small piece of the puzzle. We have scientists measuring the amount of chlorophyll in the water to determine biomass of producers is in each sample. Samples are drawn from the plankton nets are weighed as another measure of living things in the water column. The Sipper device uses cameras and artificial intelligence to count and catalog the shadows of organisms as it is pulled through the water. Each of the measures is used to look at the same question from a different angle, and together we get a clearer picture of what is going on.
The “Easy” Part
The “easy” part of the inquiry process is data collection, and it is really hard work. All of the thought and preparation that went into designing the experiment now has to be put into action. You have to haul around heavy nets and toss devices off the ship. Water samples have to be labeled, prepared, and stored precisely or all the work is meaningless. You have to travel for days to get to a site. You have to collect samples in the August heat, in rain, at night. You don’t sleep much, and have to figure out how to fix problems as they come up without compromising your data. The wind whisks away your samples into the sea, or you put the wrong funnel in the cup, and then, because you care so much about the data, you have to start over! But in the end, you have data that means something and has secrets to share, and because you are a scientist, it is all worth the effort! You find answers to your questions, and are inspired to ask new questions and start all over again.
Our Station Sites
Our cruise this time is focusing on taking water samples from the established stations to continue the investigation. We will filter that water so that chemicals, nutrients, types of bacteria and viruses can be determined for each site. We will also be deploying a device know as the sipper (more on this later) that photographs the organisms in the water column in real time. This helps us determine what types of plankton are at each site, and may help us uncover unexpected changes at different sampling sites over time. Other scientists on board will use bongo nets to calculate biomass at the sampling sites. By collecting and precisely weighing out the plankton caught in a sample, we can estimate how much plankton is located at an entire site.
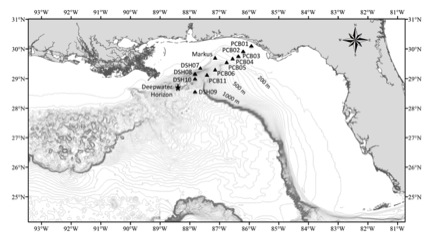
As you can see in the station map, we will be sampling along two transects, PCB (the Panama City Line) and DSH (Deep Site line) over the next week. Very often it is impossible to gather all the available data from a system- there would be too much to count, and would do damage to the system. A transect is a line that scientists use to sample representative parts of an area to gather data on things like population or biodiversity. In our case, we are working along one transect (PCB) that runs across the continental shelf from Panama City and over the DeSoto canyon, and a second transect (DSH) that runs to the south of Mobile Bay.
We are starting our sampling on this cruise with the two deepest stations (PCB11 & DSH09), and then working our way to Panama City in the Panhandle of Florida. Hopefully, we will make it to our first station some time around 8 o’clock this evening, and then the fun begins!!!
| Print article | This entry was posted by greely on August 6, 2013 at 6:16 pm, and is filed under Oceanic Updates. Follow any responses to this post through RSS 2.0. You can leave a response or trackback from your own site. |